Features for Error Reporting, SMART, Log Pages, Failures and management capabilities in NVMe Architectures
Technology FeaturesOut of Scope
Reliability and availability features that are meant to protect SSDs from data loss, e.g. controller architecture to prevent silent data corruption, PCIe features, NVMe™ end-to-end data protection / protection information (PI). PCIe® technology already has robust error management, end-to-end data protection, CRCs and link management.
NVMe™ Management Interface (NVMe-MI™) Specification
NVMe-MI™ specification manages NVMe SSDs out-of-band (outside of the operating system) through the SMBUS/MCTP and PCIe/VDMs interface. This is mainly used by host BMC (baseboard management controllers) to check inventory, monitor for errors, track SMART and endurance, and be able to report through a management console (for example, Dell iDRAC). This is important for OEMs that support multiple operating systems (Windows, Linux, VMware) and want one management console.
Asynchronous Events
NVMe controllers / drives have the capability to report an event to the host software when it detects an error, SMART event, when various attributes on the drive change, or when completing event (e.g. Securely erasing an SSD which safely deletes all user data.
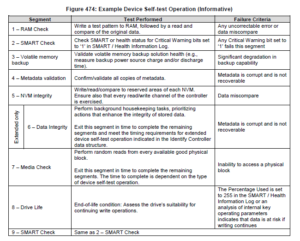
Device Self-Test Command
This feature in the NVMe specification allows the host to start a short or long self-test that is meant to be run for offline diagnostics. Many OEMs, ODMs, and system integrators use this in the factory when putting in a new NVMe SSD to ensure that everything is working properly. The NVMe specification has an example of a self-test but vendors can do deeper offline diagnostics if they wish during the SSD implementation.
Error Log Page
NVMe drives maintain an error log page that reports when errors happen and log them. The log pages count number of errors, which queue it came from and which data (LBA) and namespace was affected.
SMART Log Page
This log page is used for general health information about the drive. The main health indicator is called the critical warning – when this is enabled the drive has a problem. The NVMe controller/drive will inform the host on the type of issue: the drive is in a degraded or read only mode due to media errors, a hardware failure, or the drive is currently exceeding the temperature threshold and/or throttling. The drive can also send the host an asynchronous event when this happens, so it is aware when a drive fails. The SMART will summarize the error log page for media or data integrity errors and will also list the number of unsafe shutdowns which can be caused by power loss events and power on hours to calculate statistics.
Monitoring Endurance
The easy way to monitor endurance of an NVMe SSD is the SMART Percentage Used field, which is like a gas gauge for the endurance that shows the actual wear out of the drive. Most applications use this to report the endurance used or SSD life left (100% – % used) as a percentage. The available spares field can be set by the vendor to send a notification to the host when spares are below a certain threshold – this is just another way to represent endurance and is less frequently used.
Telemetry
Telemetry enables SSD vendors / manufactures to collect internal logs upon device failure. Standard human readable logs are encouraged here due to IP and internal data collection sensitivity from customers. The command can be either host or controller initiated, but generally makes sense for a host (customer in this case) to read out the telemetry log when a device fails and send that to an SSD vendor or OEM that they purchased it from for further analysis.
Persistent Event Log
Think of this as the black box recorder for the SSD. Events that happen on the SSD like errors, updating firmware, formatting, secure erase, etc. are logged in the persistent event log in a human readable form with a timestamp. An OEM or OS vendor can implement reading of this in the event manager to help data center techs identify and manage devices, or pinpoint when a specific event or failure happened.
Vendor Unique Log Pages
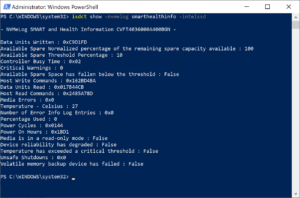
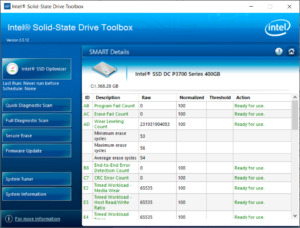
Many vendors support additional SMART information. Applications like NVMe-CLI in Linux, which is the open source management tool, support reading these vendor specific logs through plugins/extensions. Vendors also have their own tools which can decode the information. Intel, for instance, reports many other errors like NAND program and erase fail counts (predicting SSD failures at scale), PCIe CRC errors (for debugging bad PCIe connections), NAND and host bytes written to calculate write amplification, and a lot more.
Example of the Intel SSD Toolbox showing the SMART data with vendor unique information included, and the Intel SSD Data Center Tool reading SMART log in Windows:
Controller Failures
The NVMe specification has an entire section dedicated to error reporting and recovery for use of controller/drive, driver, and operating system use. Things like PCIe hotplug (surprise removal) which require setup from the host software and BIOS, PCIe error recovery, and NVMe SSD power loss protection span across many specs – but are working in every operating system today.
Using the Features to Detect Failures
Monitor the async events, read SMART often and monitor critical warning!
Using the Features to Predict Failure
An FMS 2019 presentation by Brennan Watt of Microsoft on predicting SSD failures at scale illustrates this. Basically, it’s reporting the logs listed above and running AI and analytics on it at scale to predict SSD failures before they occur.
Contributor: Jonmichael Hands – Intel